Python in Excel
Background
My biggest gripe with Python in Excel is that it's difficult to test and debug. I wanted to write and test this outside of Excel first, but there was no easy way to do that.
With a little help from Co-pilot and wrote a small Python library that mimics the Excel environment. You read in the Excel file, and use the xl() function as you would in Excel and then write, test and debug in your favorite IDE.
Here is the xlshim library: xlshim.py
NOTE: One word of warning - Excel limits the length of the Python code you can enter in a cell to 8192 characters, so keep the code compact...
Example
I have an Excel file example.xlsx which contains the following:
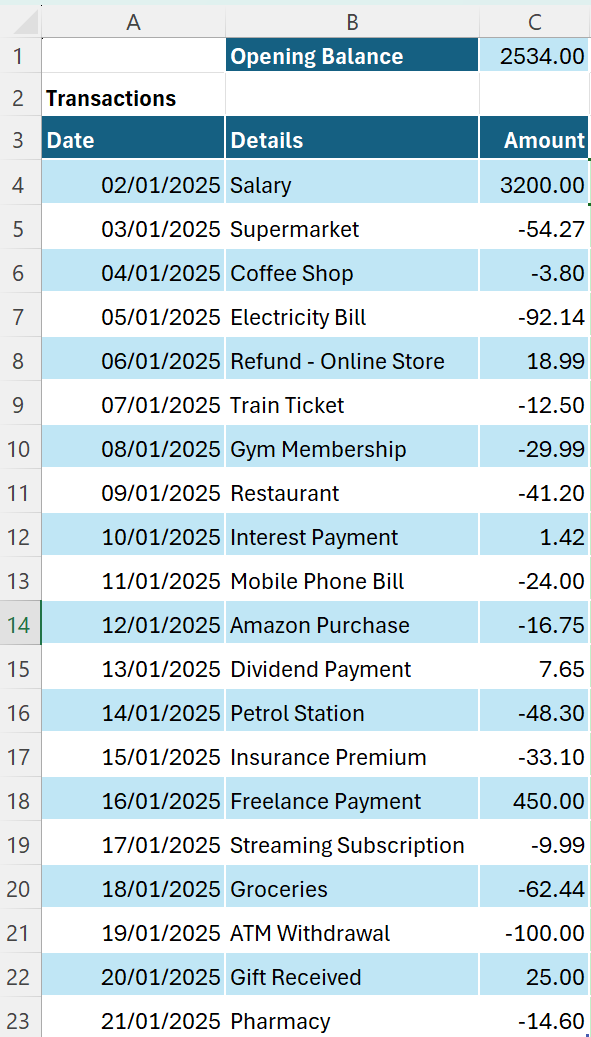
The Opening Balance is in a cell named openingBalance, the table is named transactions.
Writing and Testing Outside Excel
Here is the Python code that uses the xlshim library to read the Excel file, process the transactions and calculate a cumulative balance.
from xlshim import load, xl

load("example.xlsx")

opening_bal = xl("openingBalance")  # Single value from named cell
trans = xl("transactions[#All]", headers=True, type="T") # Table with headers

# Note:
# - [#All] is important in the Table read otherwise the header is ignored even though headers=True
# - type="T" is not a Excel xl() parameter, but is needed here and is ignored in Excel is used

bal = opening_bal
balances = []

# Iterate through the table rows
# (could simply use balance = opening_bal + trans["Amount"].cumsum())
for _, row in trans.iterrows():
    bal += row["Amount"]
    balances.append(bal)

# Add to the trans data frame
# (an unnecessary step here, could instead return balances)
trans["balance"] = balances

# Return to Excel (.values return only row, no header)
print(trans['balance'].values)
When run, this produces the following output:
[5734.   5679.73 5675.93 5583.79 5602.78 5590.28 5560.29 5519.09 5520.51
 5496.51 5479.76 5487.41 5439.11 5406.01 5856.01 5846.02 5783.58 5683.58
 5708.58 5693.98]
Using in Excel
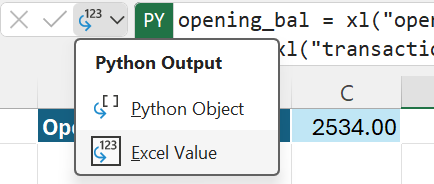
To use the above python code in Excel, you simply copy and paste it into a cell using the =PY() function, change the cell type from Python Object to Cell Value and in the Python, replace the final print() statement with just the value to return, in this case trans['balance'].values.
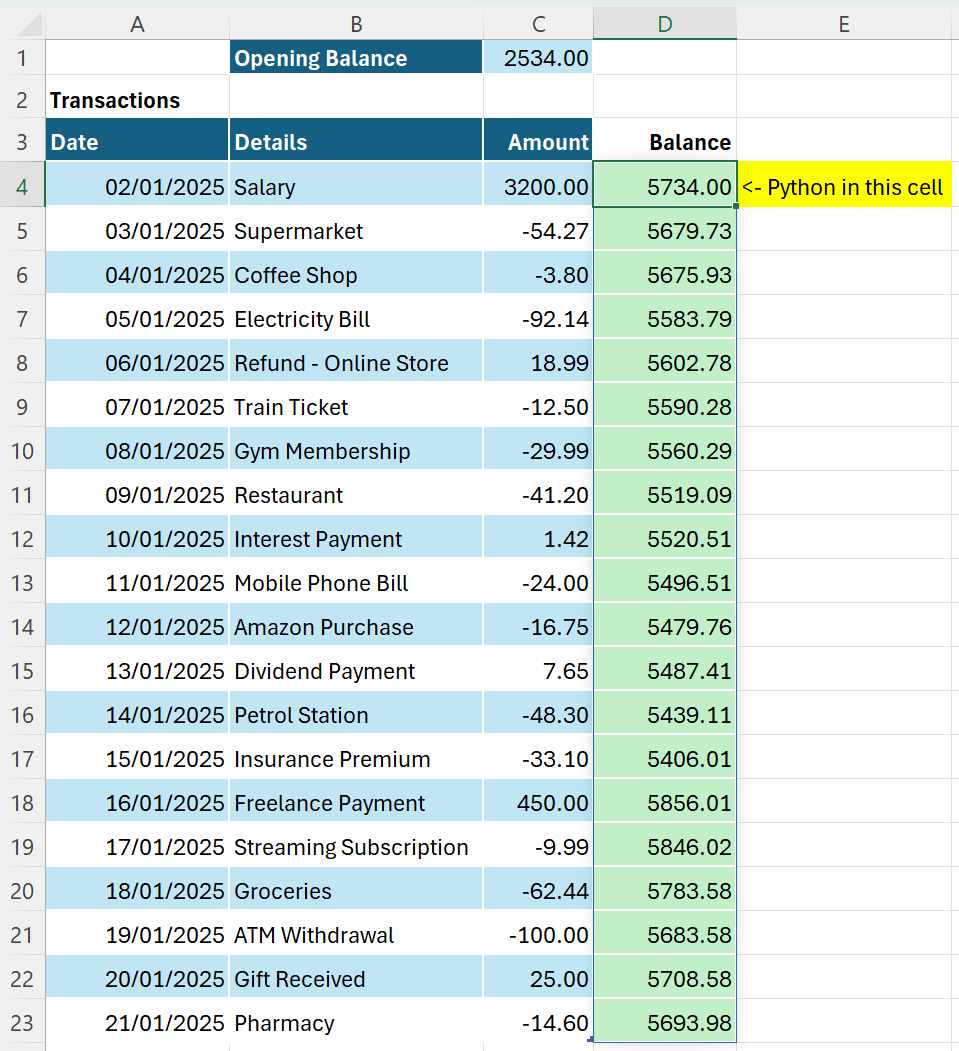
This produces the following in Excel:
Example 2
Using the same Excel file, here is another example that calculates the total debits and credits and added them as a Stats table.
from xlshim import load, xl

load("example.xlsx")

opening_bal = xl("openingBalance")  # Single value from named cell
trans = xl("transactions[#All]", headers=True, type="T") # Table with headers

# Separate Credits and Debits using Vectorized Masks
amounts = trans["Amount"]
credits = amounts[amounts > 0]
debits = amounts[amounts < 0]

# Calculate final balance
total_credits = credits.sum()
total_debits = debits.sum()
closing_bal = opening_bal + total_credits + total_debits

# Create the stats table
stats = [
    ['Credits', len(credits), total_credits],
    ['Debits', len(debits), total_debits],
    ['Closing Balance', '', closing_bal]
]

# Return to Excel
print(stats)
When run, this produces the following output:
[['Credits', 6, 3703.06], ['Debits', 14, -543.08], ['Closing Balance', '', 5693.98]]
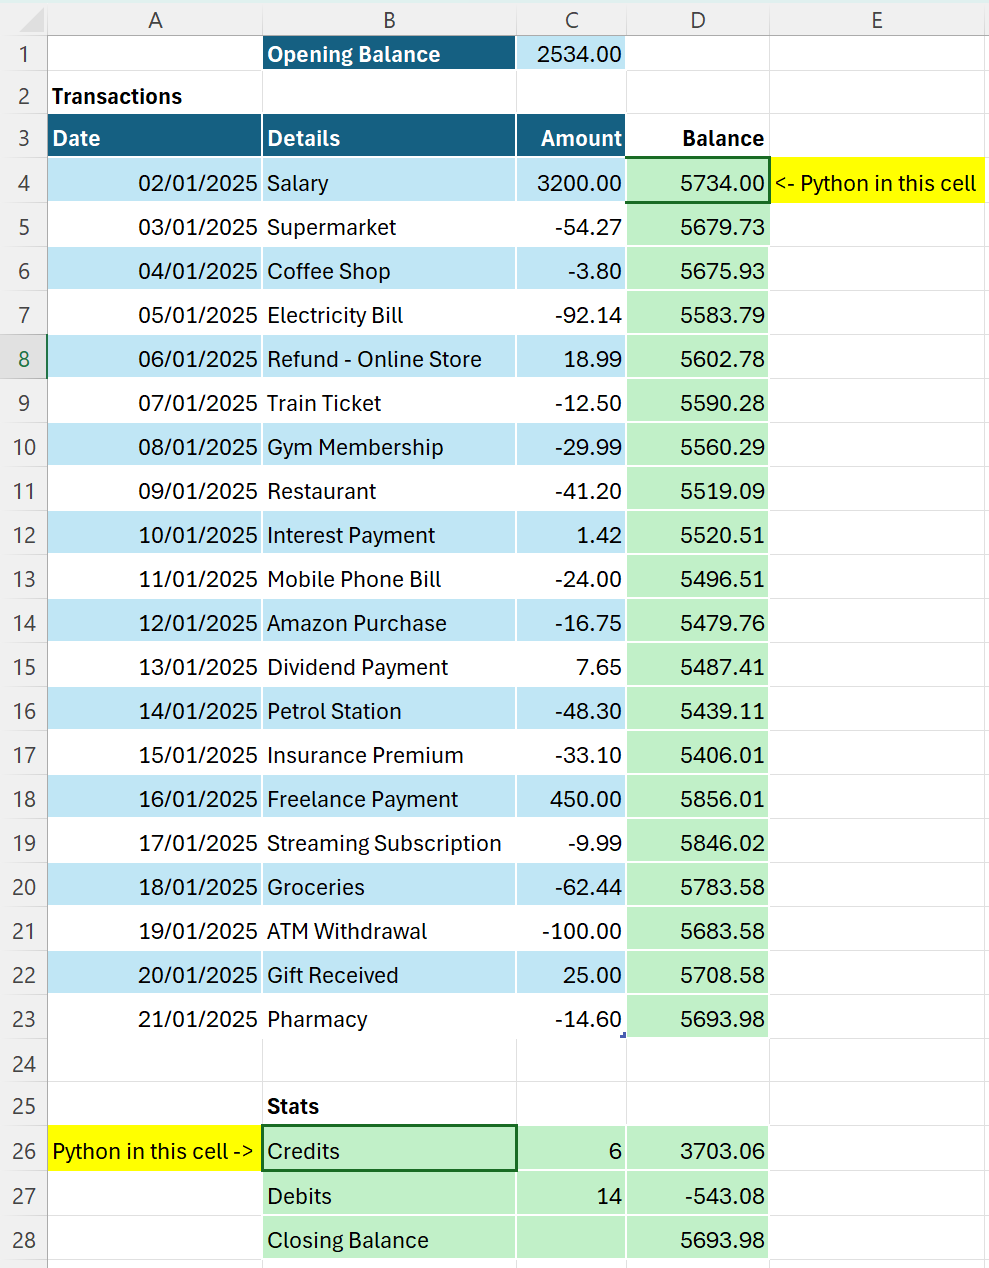
When used in Excel, this produces the following: